AirBnB Market Analysis
in Broward County
This project is designed to provide meaningful insights to potential investors interested in short-term rentals.
Introduction
In this project I used data analysis and visualization to explore key factors affecting pricing, revenue generation, and investment opportunities in Broward County, Florida.
Goal
Provide meaningful insights and assist investors in making informed decisions to optimize their pricing strategies and improve their revenue potential in a short-term rental investment located in Broward County.
Results
The project's results are presented through a Tableau visualization. In addition, a brief report is included at the end of this page with a summary of key insights and recommendations.
Tools used:
- Data collection and exploration: Website: " Inside Airbnb". Published online at insideairbnb.com.
- Data exploration: Excel
- Data Visualization: Tableau.
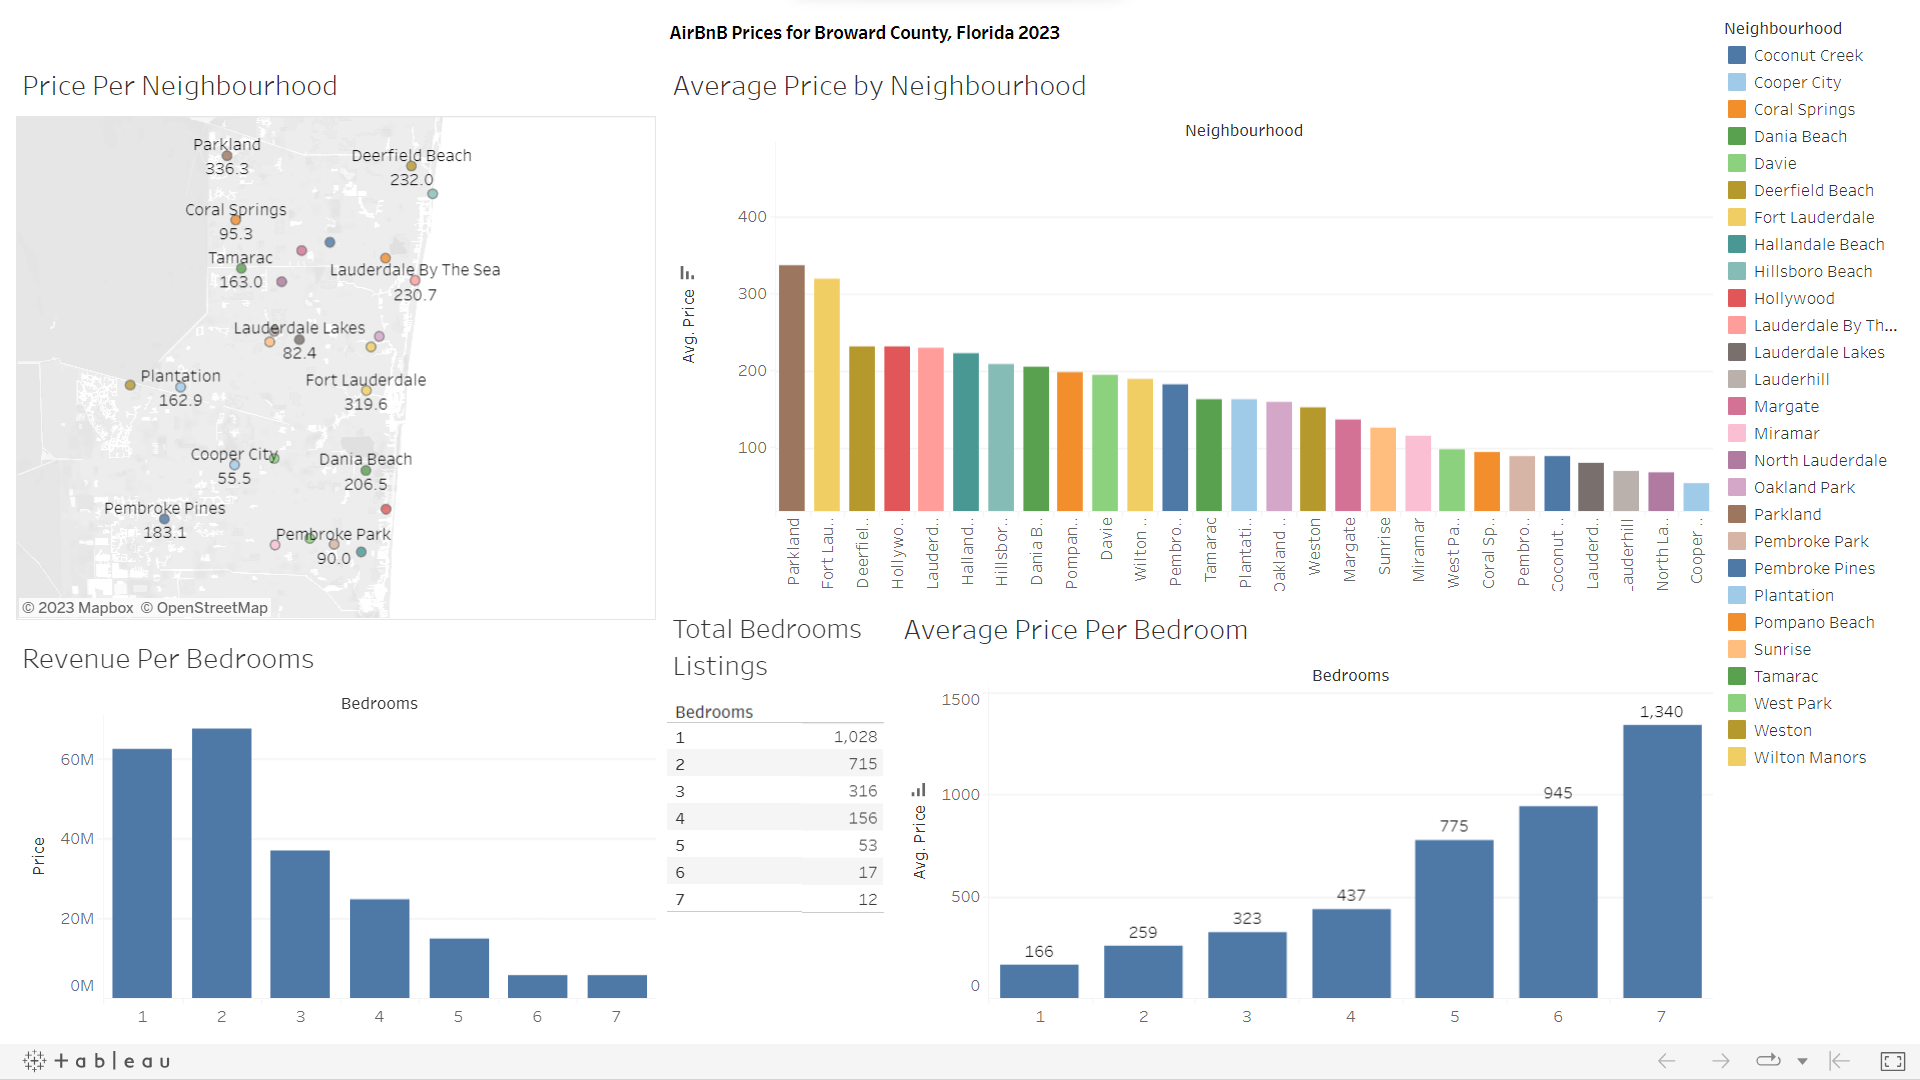
Case - How does location and number of rooms per listing affect revenue generation in the Broward County AirBnB market?
- The average price for Broward County areas range from $55 to $340 approximate. Parkland ($336.30), Fort Lauderdale ($319.60), and Deerfield Beach ($232.00) are the neighborhoods with the highest average prices, indicating that they may be more desirable or in-demand areas for short-term rentals. To optimize rental revenue potential, consider investing in properties located in higher-priced neighborhoods.
- Two-bedroom listings generated the highest total revenue, reaching $67,606,674. This suggests that properties with 2 bedrooms are particularly attractive to guests and potentially offer higher rental income.
- Listings with 1 or 2 bedrooms dominate the market with 1,028 and 715 listings, respectively. Therefore, smaller properties seem to be more common and suitable for many travelers.
- As the number of bedrooms in a listing increase, the average price per listing also tends to rise. Properties with 7 bedrooms command the highest average price of $1,340.
- Website (data collection): Click here.
- Tableau (visualization): Click here.
I created an interactive dashboard that shows the diverse price ranges across different visualizations. This includes neighborhoods, the number of listings per bedroom, the average price and total revenue per bedroom. To see the insights and interact with the data, please explore the Tableau dashboard.
Visualization:
Click here to interact with the Tableau Visualization.